Brief / The list
Financial Accountability Office of Ontario
Known homelessness, on Ontario’s own list
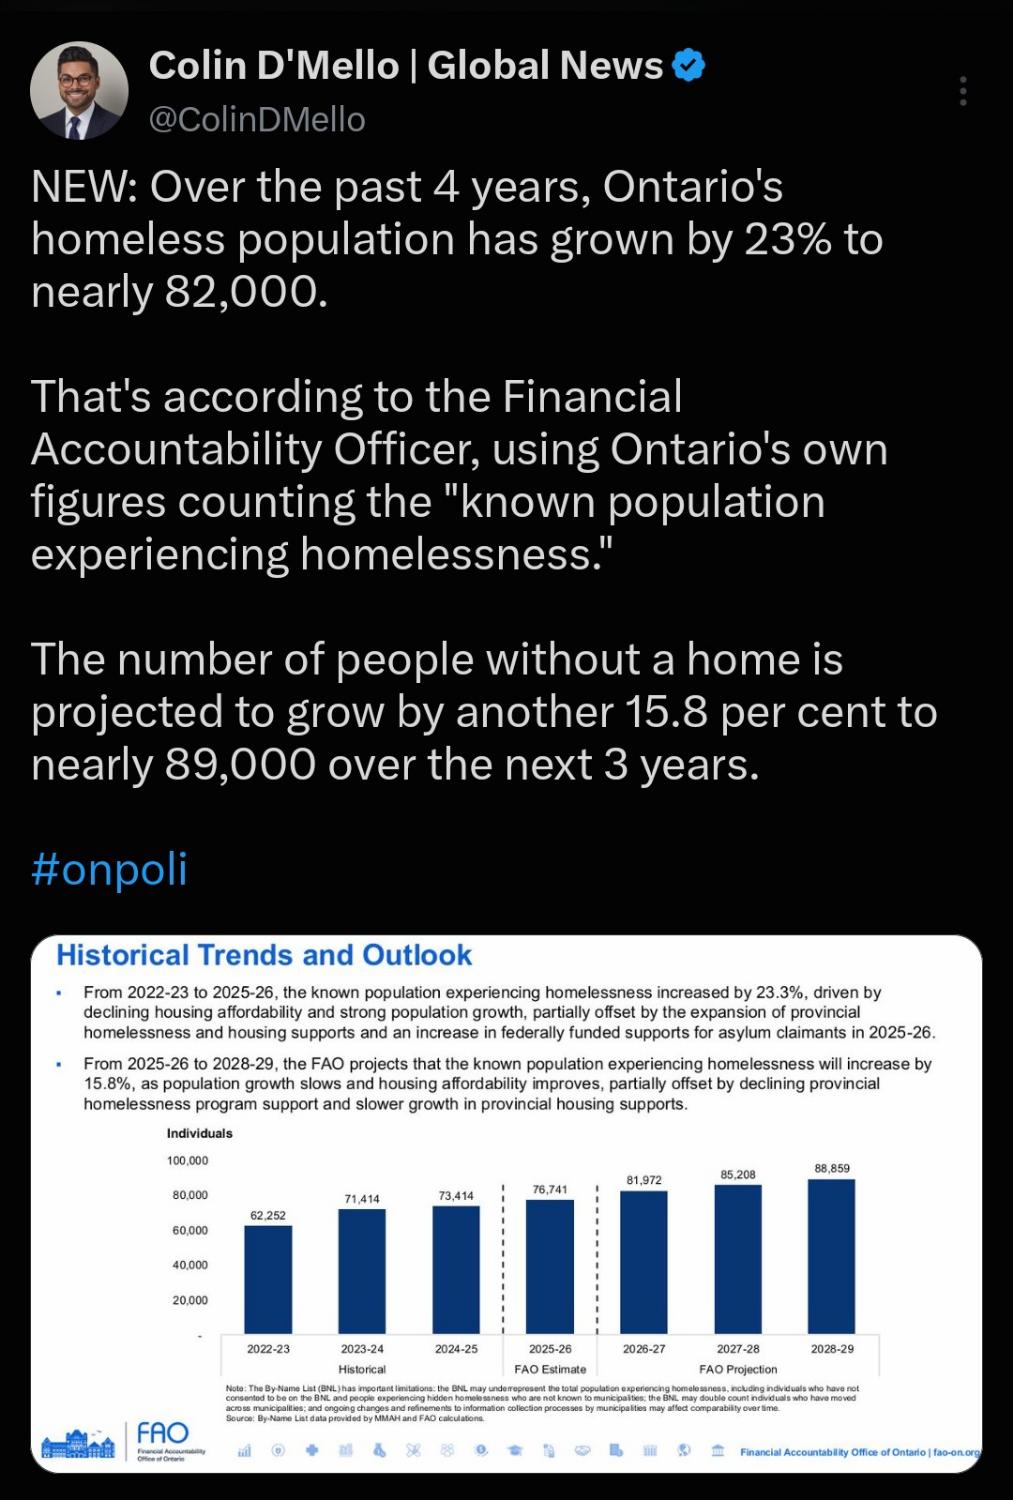
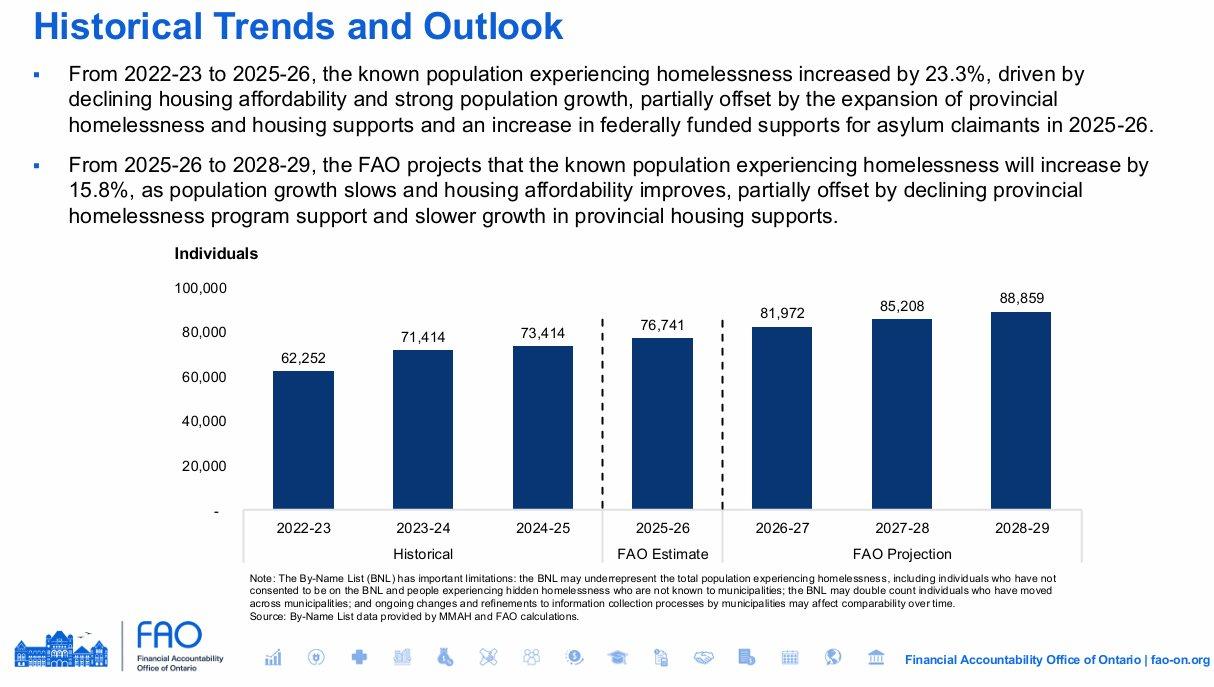
The FAO publishes the By-Name List count of people known to municipalities as experiencing homelessness, with a forward outlook. The list undercounts hidden homelessness and people who have not consented to be named. From 62,252 in 2022–23 toward a projected 88,859 in 2028–29 — while OW stays at $733, ODSP at $1,436, and the federal disability “lift” at $204. Unsheltered, emergency sheltered, provisionally accommodated, and at risk are four levels of the same policy failure — not four separate misfortunes. The lists rose in city after city because the units and the cheques did not.
Historical · FAO estimate · FAO projection. Peak in the outlook: 88,859 in 2028–29.
The FAO’s two sentences
2022–23 to 2025–26: known homelessness +23.3%, driven by declining affordability and population growth, partly offset by more provincial homelessness supports and federal asylum-claimant funding.
2025–26 to 2028–29: FAO projects a further +15.8% to 88,859, as population growth slows but provincial homelessness-program support declines.
Spending is not the same as a unit
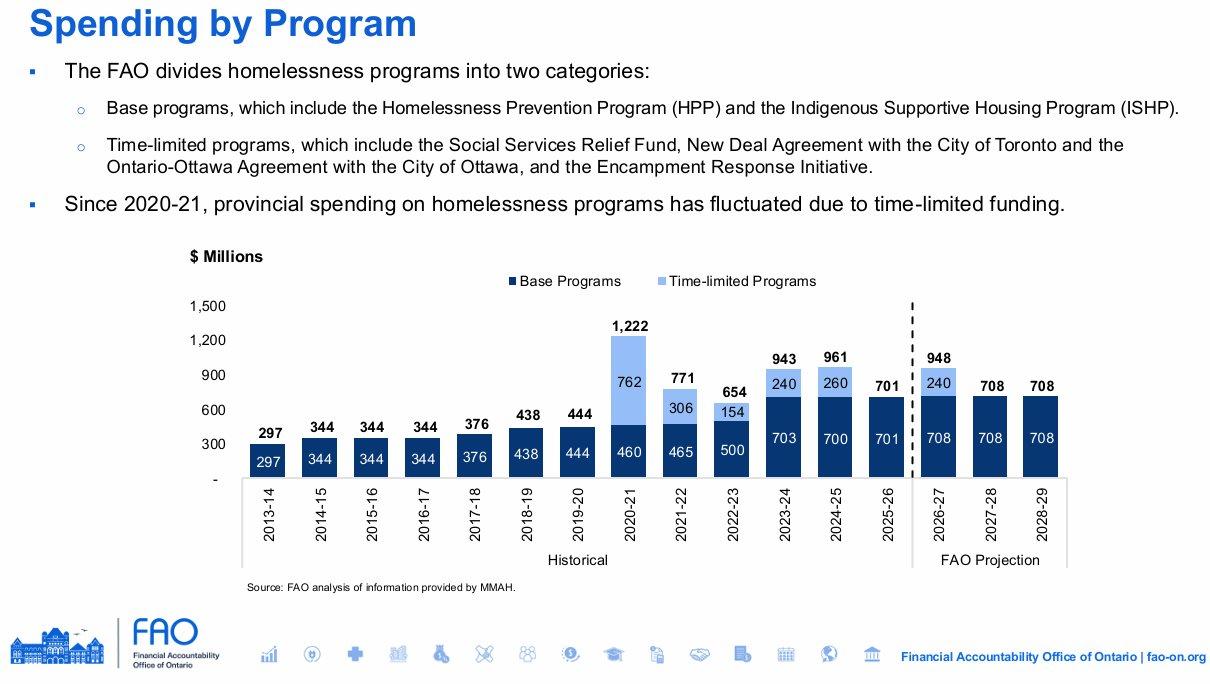
Provincial homelessness spending spiked with time-limited COVID, New Deal, Ottawa-agreement and encampment funds, then falls back toward a $708 million base in the FAO projection for 2027–29. Base programs (Homelessness Prevention Program, Indigenous Supportive Housing) hold; the time-limited layer recedes.
Waterloo Region’s FOI file is the municipal version of the same mistake: $1,695,006 to outside counsel to clear an encampment the court would not let them clear. That is not a unit. It is a legal-services contract on top of legislated destitution. The invoice and the Charter ruling →
Where the increase landed
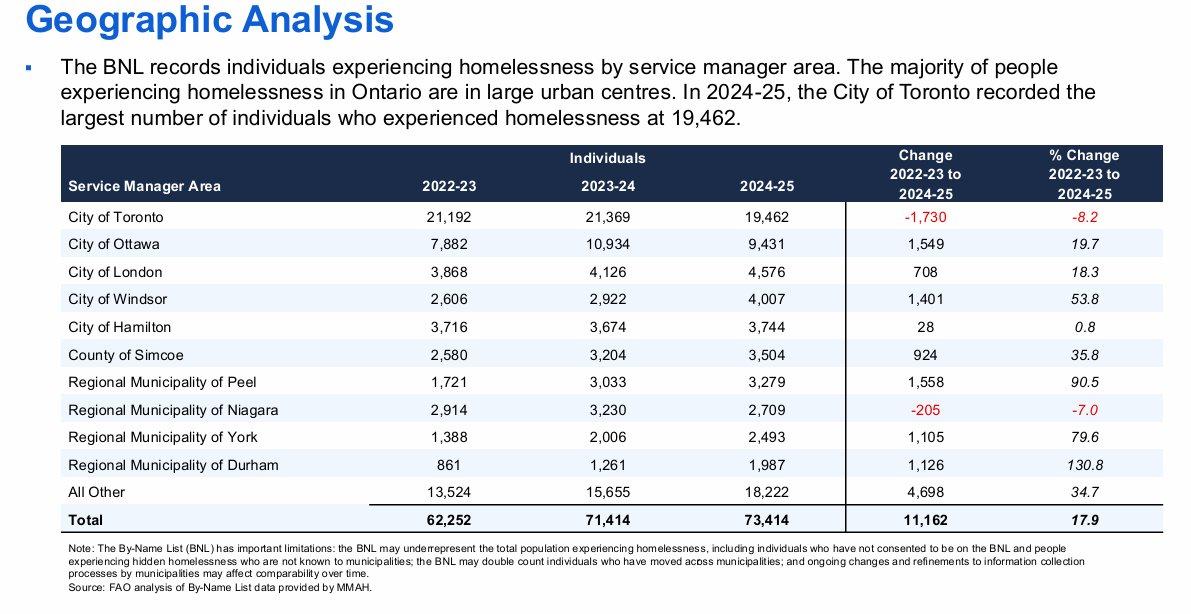
Toronto remains the largest count (19,462 in 2024–25) but fell 8.2%. Growth elsewhere is the story the provincial total conceals.
| Service manager | 2022–23 | 2023–24 | 2024–25 | Change | % |
|---|---|---|---|---|---|
| Toronto | 21,192 | 21,369 | 19,462 | -1,730 | -8.2% |
| Ottawa | 7,882 | 10,934 | 9,431 | +1,549 | 19.7% |
| London | 3,868 | 4,126 | 4,576 | +708 | 18.3% |
| Windsor | 2,606 | 2,922 | 4,007 | +1,401 | 53.8% |
| Hamilton | 3,716 | 3,674 | 3,744 | +28 | 0.8% |
| Simcoe | 2,580 | 3,204 | 3,504 | +924 | 35.8% |
| Peel | 1,721 | 3,033 | 3,279 | +1,558 | 90.5% |
| Niagara | 2,914 | 3,230 | 2,709 | -205 | -7% |
| York | 1,388 | 2,006 | 2,493 | +1,105 | 79.6% |
| Durham | 861 | 1,261 | 1,987 | +1,126 | 130.8% |
FAO plates